ADA Price Analysis – June 11
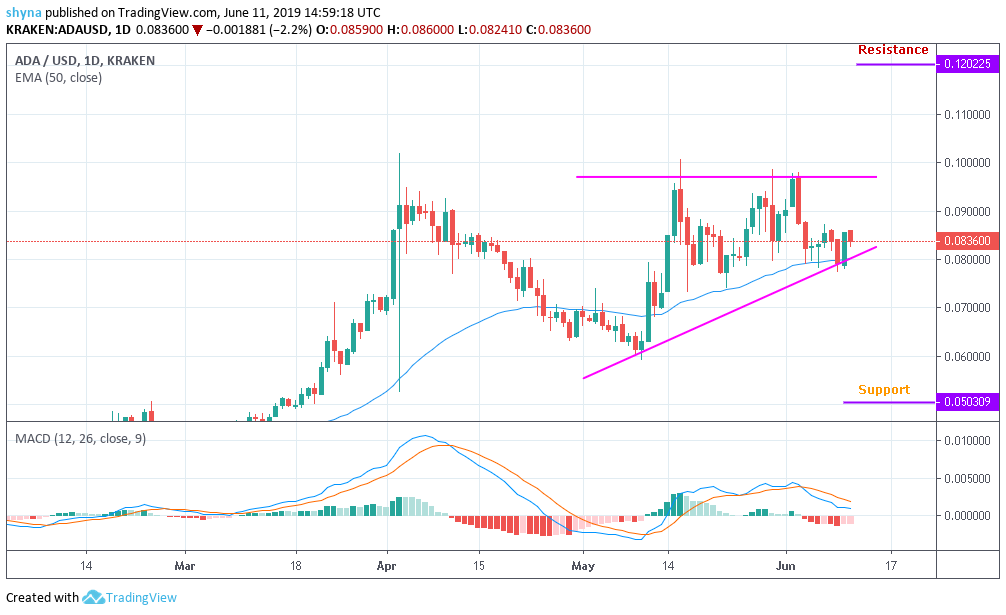
Cardano (ADA), -3.51% is still in the formation of ascending triangle from last month, while the market was between the levels of $0.059 and $0.1 of the last four weeks, showing an undecided market. As it stands, the ADA market is volatile, with prices that fluctuate from June 3 after a fall of $0.098, the weekly opening.
ADA/USD Market
Key Levels:
Resistance levels: $0.12, $0.14, $0.16
Support levels: $0.050, $0.040, $0.030

Cardano is trading around $0.084. In the range of triangles, the closest support is at $0.05, with a resistance close to $0.12. If the market increases, additional resistance can be found above the $0.14 triangle. Below the triangle, we can expect support around $0.04.
However, if we look at the daily MACD, it is obvious that the market is starting to fall after yesterday’s sharp rise, which was actually noticeable for the indicator. Since then, Cardano has been closely leveled above the zero levels. Today, June 11, 2019, the price is struggling to stay around $0.083 by not dropping EMA 50 (red line) to reach support level at $0.050, $0.040 and $0.030, which could not be visible because the price remains above the exponential moving average for 50 days.
ADA/BTC Market
Compared to BTC, the support level of this range is built around 603SAT. The resistance is set at 1541SAT because the market price is still changing under the 50 day EMA. Technically, the price started moving laterally along a symmetric triangle since May 26 and the RSI 14 signal line is still trying to go beyond level 50.
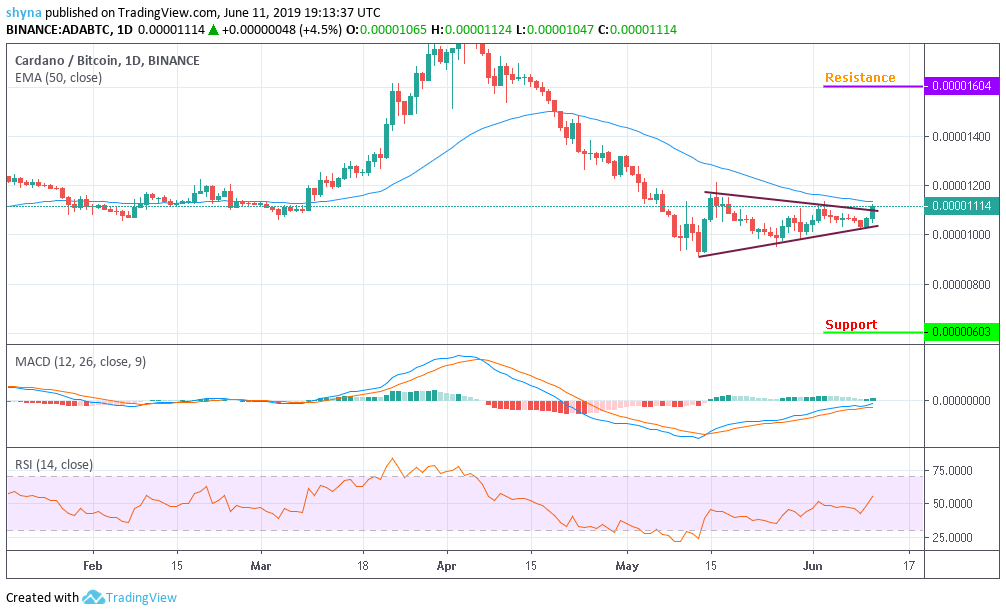
At the same time, the MACD indicator on the daily chart is bullish and is currently generating a weak buy signal that points to the green bar of the indicator, indicating that buyers are at stake. But if the price crosses the blue line of EMA 50 and that the signal line of RSI 14 passes above level 50, it is likely that the bulls are being managed. Otherwise, the bears take the market.
Via cryptovibes.com


